
A first Map of a Money Machine
A money machine, like any real trading process, or even a hedge fund, has many components. That complexity is not incidental; it is fundamental. Building such a system requires a wide range of skills: software engineering, data architecture, statistics, strategy design, risk modeling, and more, to be brought together with conceptual clarity and a diverse stack of technologies and systems.
For a journey as big as this we start with a map. A map helps us navigate complexity. It gives us an overview of what we aim to build; not just as a blueprint, but as a guide to focus attention, track progress, and anchor discussion. It allows us to reason about subsystems, iterate on versions, and connect the structure of the machine to the philosophy that drives it.
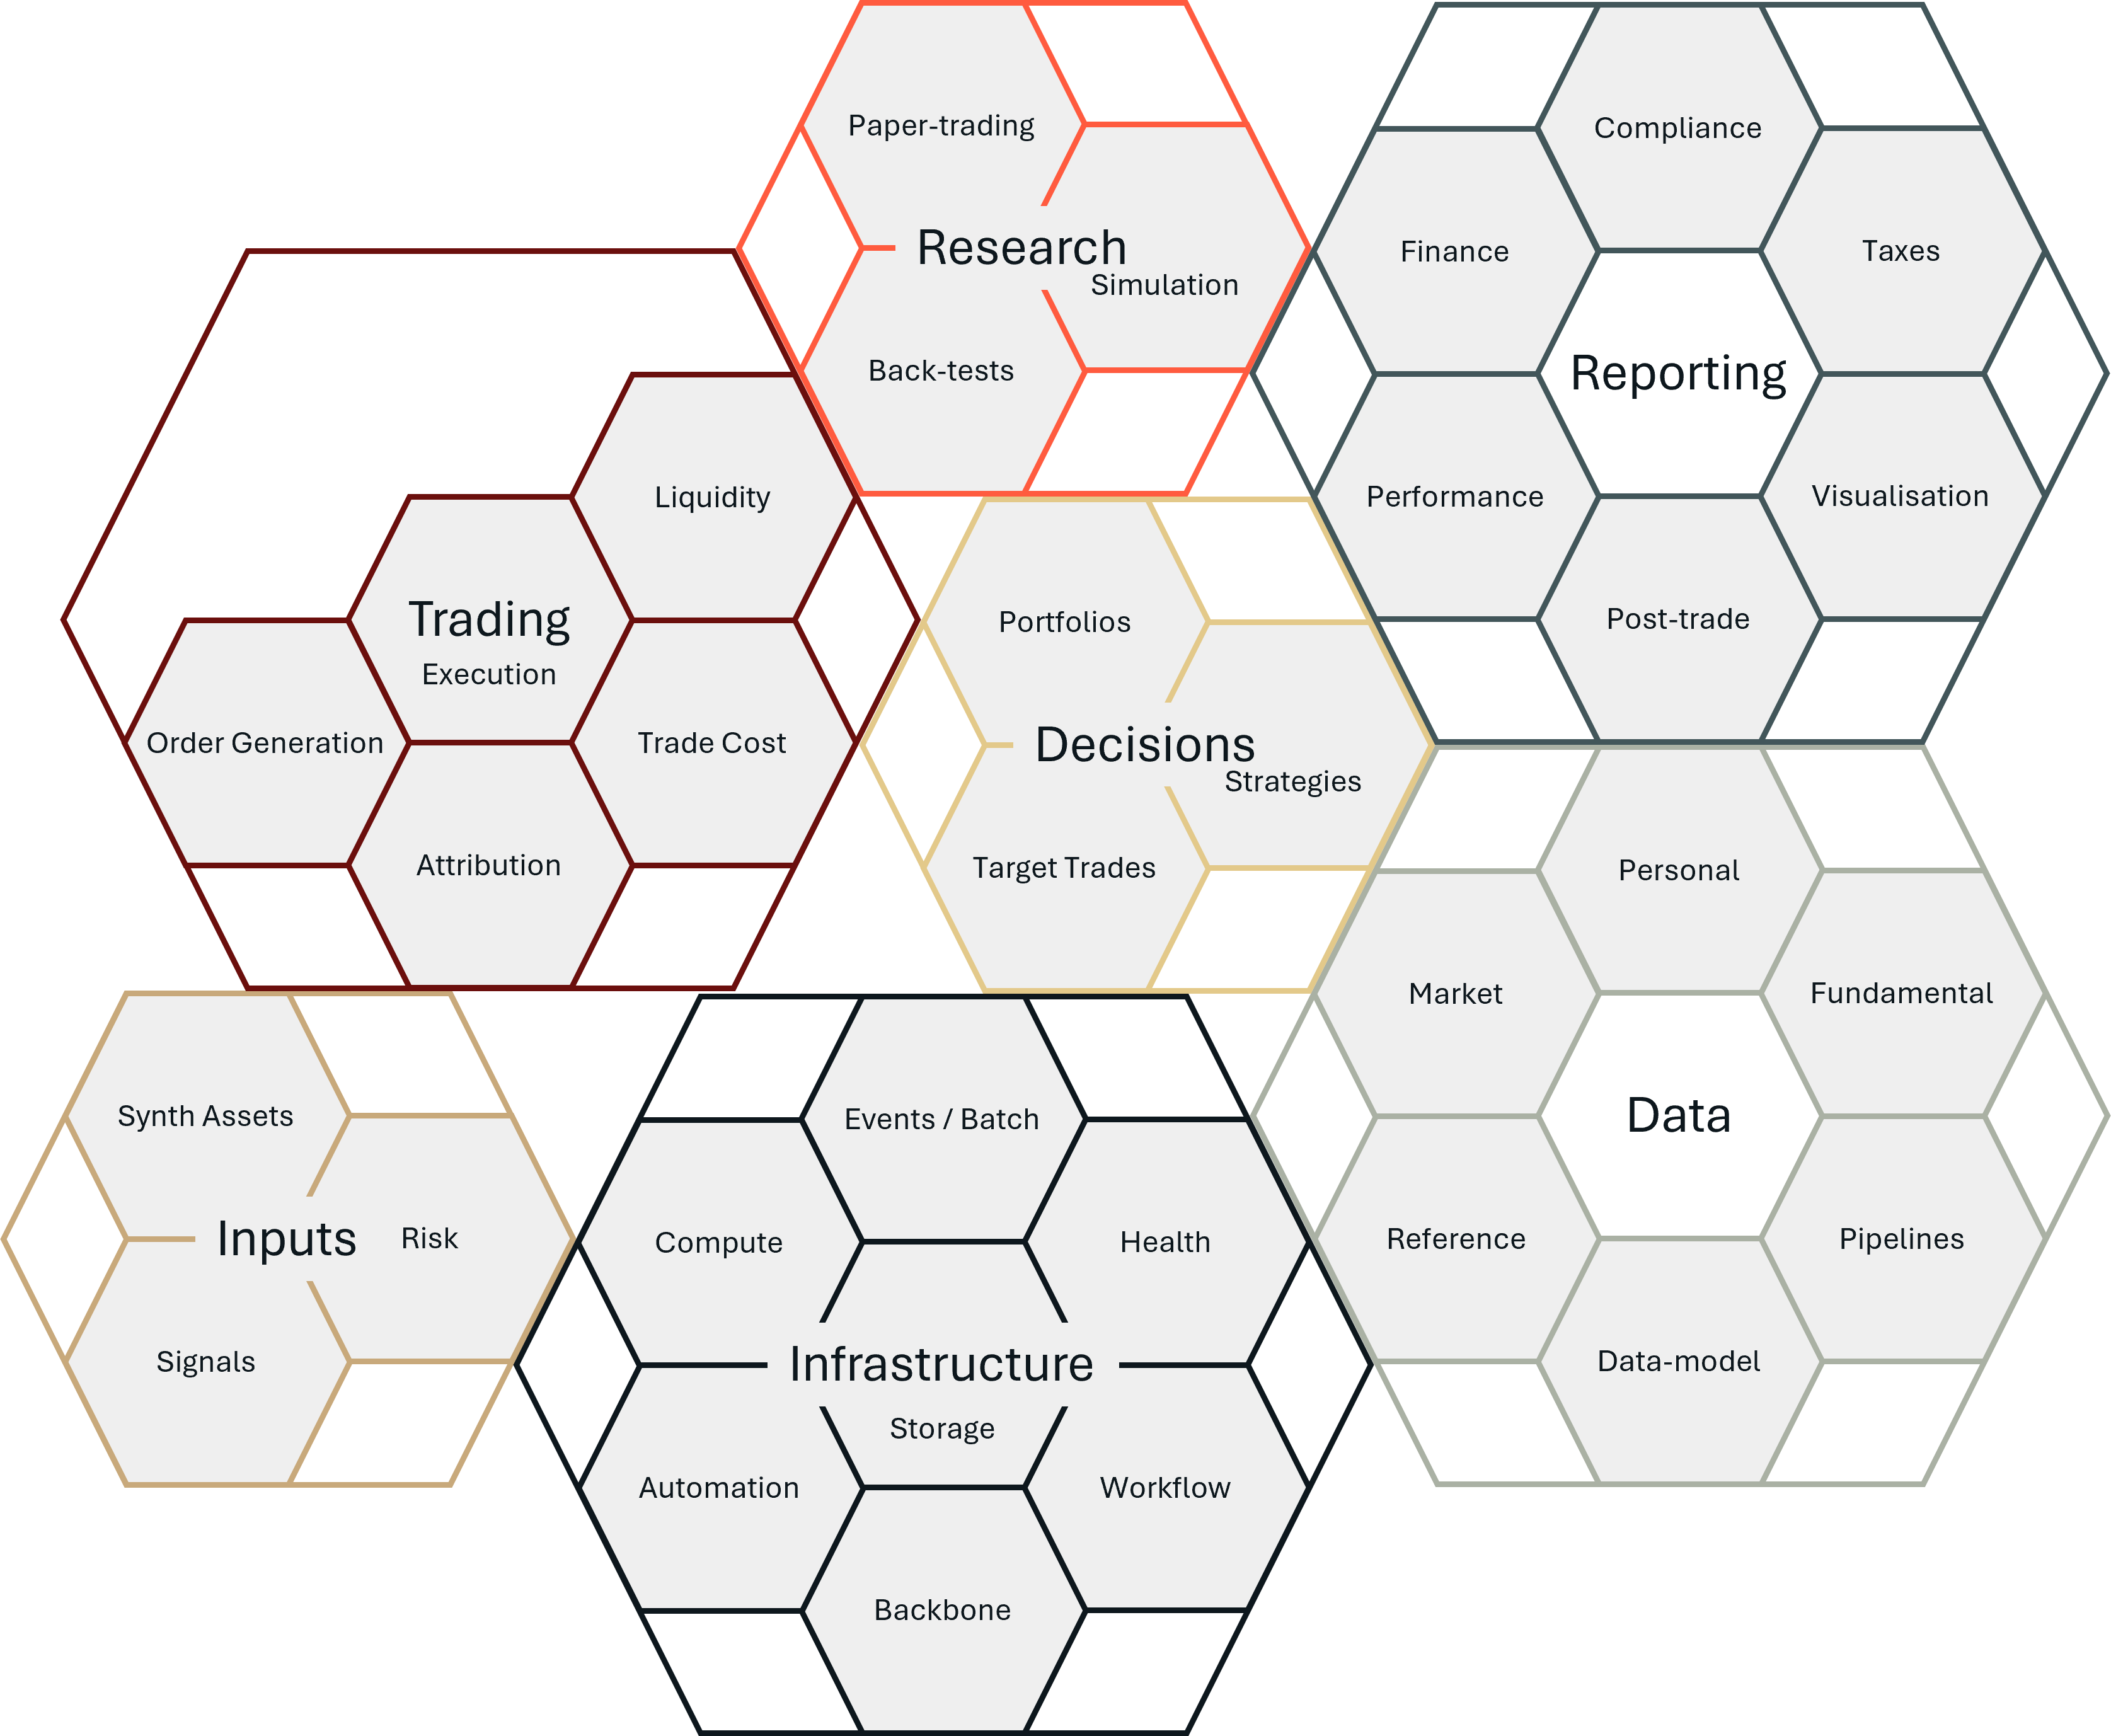
What follows is the first version of that map: a modular, visual breakdown of the core components of the Money Machine. For each component, we will explain what it does, why it matters, what different levels of sophistication might look like, and what key questions are at stake. In future posts, we will dive deeper into the development philosophy behind the machine, the trading principles it expresses, and the plan for how we evolve from version 1 to version n. Each of those directions will trace back to this same map: a shared mental model of what we are building and why.
1. Decisions
A money machine, like any rigorous trading process, is fundamentally a system for making decisions. These decisions are about how we deploy our money over time: where we put risk, what we hold, when we act, and how we respond to new information.
There are different conceptual frameworks for thinking about this. One is investing: allocating capital to productive economic assets (like stocks or bonds) that pay dividends, yield interest, or appreciate over time. Another is speculation: taking positions in anticipation of future price movements. In reality, most trading processes combine both, and we will discuss the unifying perspective of decision theory and expected utility maximization in a future post.
But for now, we stay focused on what they all have in common: Allocating risk dynamically over synthetic assets, based on information and intent.
At the core of this system is the dynamic allocation of capital to assets. These assets are often synthetic; not raw financial instruments, but abstract combinations of them that better express a particular view, strategy, or utility profile see Synthetic Assets.
We construct strategies by combining one or multiple signals (some predictive structure or hypothesis), one or multiple synthetic asset (what we are betting on), and a trading logic (how we move into position). The output is a target holding; the position we want to reach based on our current beliefs and preferences.
For example, a strategy might decide to allocate 40% to tech stocks, 30% to government bonds, and 30% to cash; and update these weights weekly based on macroeconomic signals like inflation or interest rate forecasts. This is a dynamic linear combination of holdings, driven by evolving inputs and bounded by constraints.
1.1 Strategies
Strategies define how we combine signals, assets, and risk models into a process that generates target positions. Each strategy has:
- A conceptual rationale
- A time horizon
- A specific research and validation process
- A goal (e.g., alpha generation, diversification, hedging)
In the system, strategies live alongside each other and may differ radically in structure, but they all produce clear position targets in instruments and synthetic assets.
1.2 Portfolios
Portfolios combine strategies into a coherent whole. This is the second level of allocation; not just which assets to hold, but which strategies to run, and in what proportions.
A portfolio might balance strategies for:
- Short-term trading and long-term investing
- High-risk directional bets and low-risk mean reversion
- Different instruments (ETFs, futures, options)
In many cases, we will have multiple portfolios; for example: - A long-only ISA account (with constraints like no leverage and no shorting)
- A margin trading account (allowing full flexibility)
Each portfolio has its own preferences, constraints, and optimization logic.
1.3 Target Trades
Even once we know our targets, we have to get there; and trading is not free.
The target trades step determines what trades we should make, given:
- Our current holdings
- Our desired target holdings
- The costs and frictions of trading
- The urgency or flexibility of the transition
We may decide to slow down certain trades, delay execution, or batch actions; especially when market liquidity is thin or transaction costs are high.
From V1 to Beyond
Our first implementation will start simple, but conceptually grounded and technically rigorous:
- A long-only ETF strategy, dynamically allocating based on technical (i.e. market-based) signals across a universe of a few dozen ETFs spanning major asset classes. This portfolio will be built to manage holdings in tax-advantaged, long-only, no-leverage accounts like a UK ISA, SIPP, or US 401(k). Decisions will be made at daily frequency.
- A technical futures strategy, trading directionally on synthetic assets built from a broad universe of 100+ futures contracts. This will run in a margin trading account. Initially the strategy will rely on market-based signals, but we will soon add fundamental (i.e. supply & demand) data, especially in the commodity space. Decisions will be event-driven, with time horizons ranging from minutes to multiple days.
These development stages loosely align with the frameworks presented in Rob Carver’s Smart Portfolios[1] (for the long-only strategy) and Advanced Futures Strategies[2]. A fellow ex-investment professional with a background in bond trading, Carver does a superb job of breaking down relatively sophisticated strategies into simple, but not simplistic, implementations. His choices are guided by a well-honed intuition about where to cut corners and where to preserve rigor.
My own approach differs in emphasis: rather than writing for a general audience, I am building a full-scale, professional-grade implementation. That means: - Top-end portfolio optimization methods
- Robust back-testing and simulation frameworks
- Sophisticated execution and trade-cost modeling
- And deeply modular system design
Where Carver offers intuitive shortcuts, I aim to build the infrastructure that allows us to earn those shortcuts; or bypass them entirely. (On his blog Carver is exploring more technical detail and depth that underlies the assumptions in his books).
2. Inputs
No decision happens in a vacuum. Well, few do. Rather, every strategy depends on what it sees, how it frames the world, and what it believes is possible. That is the role of the Inputs layer in the Money Machine. Here, we ingest raw information, from markets, fundamentals, and internal data, and transform it into structured, actionable components that inform how capital is allocated. This process involves both representation and belief formation: Representation through synthetic assets, which define the things we care about and trade, and belief formation through signals, which assign predictive meaning to those things, and additionally, risk, which evaluates uncertainty, variability, and adverse outcomes; shaping not only how much we allocate but when and how confidently.
This layer is conceptually dense. It is where data science, economics, and probability intersect with financial intuition and domain knowledge. And it is where we must build both sensitivity (to opportunity) and resilience (to regime change).
Each of the following components, Signals, Synthetic Assets, and Risk, plays a critical role in translating the real world into decisions. They are the lenses through which the Money Machine sees, feels, and prepares to act.
2.1 Synthetic Assets
In the Money Machine, we do not just trade raw financial instruments. We trade instruments to express views and target positions in synthetic assets: abstractions built from one or more instruments, engineered to express a specific economic view or structural relationship.
What is an Asset? An asset, at its core, is something of economic value; something we can hold, own, and (in financial markets) exchange through instruments like stocks, bonds, or futures.
But in our system, we go a step further. Finance is inherently recursive: any combination of trades can itself be understood as a strategy, and every strategy can be packaged up into a standard unit of investment and thus be framed as a new asset (that is the core idea behind index funds and ETFs). This allows us to construct portfolios, spreads, and views that behave like tradable entities, even if they do not exist as standalone instruments in the market.
Formally, a synthetic asset is any dynamic linear combination of holdings in instruments that we treat as a first-class decision object. These synthetic assets become the things our strategies allocate to. Signals are generated on them, not necessarily on the underlying instruments.
Why Construct Synthetic Assets? There are three key motivations:
Permanence: Most instruments (futures, options, forwards) expire. Their identities change over time. Synthetic assets, like rolling front-month futures, allow us to stitch together sequences of contracts into stable, continuous objects.
Optimality: A synthetic asset can be engineered to express a specific economic property (e.g., power plant availability, storage value, volatility skew), reflect a co-evolutionary relationship (e.g., between two yield curves), maximize predictability under a given signal or model (e.g., via regularized linear combinations of instruments that best respond to a weather-based predictor), or have preferential statistical properties (e.g. the triple-barrier method popularised by Marcus Lopez de Prado, 2018[3]).
Robustness: Synthetic assets allow us to embed structural risk-management features directly into what we trade: In this sense, a synthetic asset is not just a cleaner object to predict, it is a more stable object to hold, especially through regime shifts, by scaling risk to normalize volatility (skew, draw-down, ...) across time, by reshaping downside tails dynamically throug stop-loss logic, containing extreme outcomes with options overlays, or adapt to market conditions with regime-based composites.
Examples:
A rolling front-month futures curve for WTI crude oil
→ Continuous exposure without expiry disruption
A power spark spread: long electricity, short fuels
→ Captures power plant margin dynamics and availability
A time spread: long front contract, short deferred
→ Expresses the storage structure of a commodity market
A co-integration basket of two yield curves
→ Designed to exploit mean-reverting value relationships
A volatility-normalized macro basket
→ Equalized impact per unit risk across divergent instruments
A risk-hardened momentum strategy
→ Stop losses, trailing hedges, and forward-vol weighting built in as part of the asset definition
Synthetic assets are designed with decision-making in mind. They are the glue between data, theory, and execution. Signals are expressing views on them, trades are generated to reach them, and portfolios are constructed by combining signal expressions into strategies and deploying risk on these.
2.2 Signals
In a professional-grade trading system, we do not just hold assets because they are available. We hold them for reasons; informed, quantified, and structured reasons. That is the role of signals in the Money Machine.
A signal is a standardised, numerical representation of belief: a directional conviction, informed by theory and (|or) data, that a particular asset will move in a certain way over a specific horizon. Signals form the bridge between how the world works and how we allocate risk.
Where Do Signals Come From? There is no single theory of signal generation.
Signals arise from multiple lenses: economic, behavioral, technological, physical, statistical; each capturing different aspects of what moves markets.
Below are just three examples of such frameworks:
Risk Factors: In the risk-factor tradition, investors are compensated for bearing systematic risks, such as value, momentum, or size. These factors reflect persistent structures in how capital is allocated and priced. If an asset loads heavily on a particular factor, holding it is akin to selling insurance to the market; and the signal tells us when that trade is favorable.
Fundamental Drivers: In real-economy markets like commodities, price is grounded in physical dynamics: supply, demand, inventory, logistics, usage. A signal may arise from better or timelier information about these fundamentals, a more accurate model of how these fundamentals work together to determine fair value, or from differentiated risk preferences. It expresses a belief about where prices should move as the market digests this information.
Behavioral and Micro-structure Effects: Sometimes, the key signal is not about fundamental value, but about how others are trading. Order flow, liquidity dynamics, positioning imbalances: these shape the supply and demand for the financial instruments themselves, not the underlying assets. In this paradigm, signals are about anticipating short-term dislocations and flow-induced moves.
These are just a few of the many conceptual frames we can apply. Others may come from machine learning, macro modeling, game theory, or latent structure analysis. All aim to express, in a structured way, a belief about how prices will evolve, and why.
What Are We Predicting? Importantly, we are not always trying to predict the exact price. We are often predicting a component of the price movement, a latent factor, a differential, a behavior under a certain condition, or the direction of the price move, or a distribution or scenarios of possible prices under the given information set. Signals are often constructed on synthetic assets, not raw instruments, are scaled to be comparable across time, assets, and strategies, are evaluated not just for fit, but for stability, interpretability, and performance under stress.
Signal construction is the art, science, and engineering of shaping information into a number (or distribution, or scenario bundle), that is predictive of a useful variable, over a defined time horizon, and is usable in an allocation decision process.
Signal Construction Process: While we will not go into full detail here (see upcoming posts on [Signal Construction, 4] and [Equivalence of Preferences and Information, 5]), the typical process includes:
- Framing the prediction target: What are we trying to predict? Over what horizon? For what decision?
- Feature construction: What data might carry useful structure?
- Modeling & shaping: How do we turn features into predictive scores? Normalize them? Decay them over time?
- Signal evaluation: Does the signal work? Why? Where? Can it be trusted?
Finally, we test our signals: - In back-tests: does this signal lead to excess returns in the past?
- In simulations: does it behave coherently under structured perturbations?
- In portfolios: does it interact well with others? Add information? Create unwanted concentrations?
A signal is only as good as its ability to create conviction that survives contact with uncertainty.
2.3 Risk
Risk is not just a number. It is the language the Money Machine uses to reason about uncertainty, fragility, and the boundaries of its own knowledge. If a signal tells us what to believe, and a strategy turns belief into position, the role of risk is to ask: how confident are we? What might go wrong; with the market, with our assumptions, or with our models?
In the Money Machine, risk is embedded everywhere: in assets, strategies, portfolios, even in how we treat information. It is not a final step before trading it is a structural input into the entire process, entering the decision process in multiple, yet clearly specified ways. We treat risk as a multi-layered concept, because different parts of the system face different types of uncertainty:
We can estimate the riskiness of holdings in instruments, in synethic assets, in strategies and in portfolios. We can answer different questions, such as how much can we expect the value of these holdings to change until we can next make a decision, this can be estimated from realised market behaviour, or implied from the prices of options and other derivatives. We can also create scenarios of possible price evolutions and then ask questions about relationships between prices, as well as cumulative risk measures such as drawdowns. And finally, having fundamental models of supply, demand, and fair value of contracts we can use those to ask how far things can go wrong in the physical, economic, and socio-technical systems underlying the markets.
At the portfolio level, we also look across strategies to understand diversification, common exposures, and overall draw-down risk. And at the meta-level, we acknowledge and model the model risk; the uncertainty about whether our assumptions and estimators are even valid.
Risk is not simply passively measured. It becomes part of how the system acts and adapts. Strategies may scale positions based on signal confidence or market-risk. Portfolios may throttle or rebalance in reaction to simulated shocks. Even the execution layer may adapt trade aggressiveness to risk estimates. And on the backend, risk informs our diagnostics: when strategies underperform, when drawdowns happen, when slippage exceeds expectation; risk is how we trace causality and test assumptions.
From V1 to Beyond
In V1, the Inputs layer will implement a foundational but disciplined set of capabilities across synthetic assets, signals, and risk. These will provide a robust and testable interface between the real world and our allocation decisions.
For synthetic assets, V1 will offer a curated library of clearly defined, rule-based constructs: rolling futures, simple product spreads, and volatility-normalized baskets. These will be treated as stable, decision-ready abstractions, each engineered to capture specific economic views and to smooth over market structure discontinuities like expiry, illiquidity, or non-stationarity.
For signals, V1 will focus on transparency and traceability. Signals will be manually specified, statistically evaluated, and linked directly to economic intuition or known structures. These will include directional indicators based on fundamentals, price relationships, or behavioral dynamics, each scored and scaled for comparability and risk-awareness.
For risk, V1 will implement a suite of standard realized measures: volatility, drawdown, correlation, and wider set of return distribution diagnostics. These will be calculated across all system levels, from assets to portfolios, and used to size positions, shape strategies, and monitor system integrity.
Together, these elements will form a coherent, inspectable decision-making layer: one that makes its beliefs explicit, its assumptions testable, and its actions explainable.
In later versions, this layer will become increasingly adaptive, expressive, and recursive.
Synthetic assets will evolve from static rule sets to dynamic constructs: composed of strategies, constraints, and regime-aware logic. They will become not just containers of economic views but programmable units of structured belief.
Signals will transition from hand-built predictors to machine-assisted constructs: shaped through ensemble models, simulation-based testing, and dynamic reweighting. Performance feedback will inform real-time updating and structural diversification.
Risk will extend from realized metrics to forward-looking, option-implied, and scenario-based evaluations: integrating market, structural, and meta-model uncertainty into a unified understanding of fragility and confidence.
Ultimately, the Inputs layer matures from a descriptive scaffold to an adaptive reasoning engine: one that sees, filters, and learns in ways aligned with both our economic intuition and our operational needs.
3. Trading
Once strategies have decided what they want to trade, the system must convert these desires into coordinated actions: real-world executions that respect liquidity, costs, risk constraints, and mechanical detail. This is the role of the Trading component.
At this stage, we are no longer dealing with abstract and continuous portfolio target holdings. We are dealing with discrete, instrument-level orders that must begenerated, routed, placed, tracked, and attributed across multiple strategies, portfolios, and constraints.
This layer transforms internal structure into external action.
3.1 Order Generation
Each portfolio may want to buy or sell, based on its own strategy, constraints, and timeline. But we only have one trading account, one broker, and one market (in fact we will have multiple brokers, but for practical considerations and counter party risk management).
The order generation process is where:
- We aggregate target trades from all live strategies and portfolios.
- We net out internal flows, creating an internal liquidity pool that lets strategies trade against each other without touching the market.
- We resolve integer sizing constraints, converting floating-point target trades into actual order sizes.
- We apply global constraints like end-of-day flattening, FX hedging, or exposure limits.
- We apply execution preferences: urgency, order types, preferred routes, or position scheduling.
- We emit a set of executable orders for the external market.
At this point, the system knows exactly what it wants to do in the market, across all instruments and accounts.
3.2 Execution Engine
The execution engine is the component that places these orders into the market via broker APIs, tracks order status, retries and errors, and the full lifecycle of fills, applies execution logic (time-slicing, slippage tolerance, risk checks), and records complete metadata for attribution and diagnostics.
Robustness here is non-negotiable. We are dealing with real money. Failures in this layer can be costly, dangerous, or invisible, which makes logging, monitoring, and replayability essential from day one.
3.3 Liquidity & Trade Costs
Every trade has a cost. This component is responsible for forecasting market depth and liquidity availability in real-time or at decision points and predicting expected slippage, spread, and transaction costs. This information is fed into strategy construction (can I trade this at all?) as well as execution decisions (should I use limit or market? trade now or wait?).
3.4 Attribution
Once trades are executed, we must attribute the results back to their initiators.
For example:
Strategy A wanted to buy 18.6 units of WTI
Strategy B wanted to sell 30.4 units
Our rounding and netting engine sent a sell order for 12 units
Post-trade, we must:
- Decompose the actual fill into intent-based components,
- Track fill prices, slippage, and realized cost per strategy, portfolio, and signal,
- and maintain a full attribution log to support diagnostics, P&L allocation, and rebalancing logic.
This module ensures accountability. Every trade in the system is traceable, not just what was done, but why, on whose behalf, and with what effect.
From v1 to Beyond
In Version 1, the Trading layer will serve as a tightly scoped, robust, and testable bridge between the internal decisions of the Money Machine and the external realities of execution. Its role is to ensure that trade intent becomes market action; safely, clearly, and accountably.
Order generation will begin with strategy-level trade intents aggregated into account-level actions. These will be processed with simple constraint logic, integer rounding, exposure caps, and manual FX hedging, to produce net orders for submission, including simple internal netting between strategies, but without the full backward propagation of the attribution.
Execution will be handled through broker APIs (such as Interactive Brokers), using reliable order placement, status polling, and retry logic. Orders will be tracked throughout their lifecycle, with complete logs to support failover and diagnostics. The focus will be on correctness and traceability, rather than execution alpha.
Liquidity and trade cost estimates will be based on static historical models, for spreads, slippage, and market depth, used for basic feasibility checks and sanity bounds. These models will inform both strategy-level sizing and post-trade attribution.
Attribution will assign fills to strategy-level trade requests using proportional intent-based rules. P&L attribution, slippage diagnostics, and cost breakdowns will be logged at the strategy level, ensuring transparency and supporting further analytics.
This foundation enables live trading with accountability and system-level coherence, even before predictive execution or full stack attribution are introduced.
In later versions, the Trading system will evolve toward higher intelligence, tighter integration, and real-time adaptivity.
Order generation will incorporate more sophisticated internal liquidity netting and integer optimization for more precise sizing under constraints. Execution will become condition-aware, using smart routing, dynamic scheduling, and adaptive aggressiveness based on market state.
Liquidity forecasting will become dynamic (for example by integrating real-time order book data, volume prediction, and volatility signals). Trade cost estimation will evolve into multi-dimensional surfaces that shape both strategy and execution logic.
Attribution will mature into a layered diagnostic tool, tracing causality across signals, strategies, and risk modules. It will support auditing, simulation, and even feedback into signal evaluation and capital allocation.
Ultimately, the Trading layer will grow from a safe bridge into an intelligent actuator: one that translates intent into action while managing uncertainty, adapting in real time, and preserving accountability across the full lifecycle of a trade.
4. Research
Before a signal can drive a trade, or a portfolio can be trusted to steer capital, it must be subjected to a rigorous and self-conscious development and testing process. The Research component of the Money Machine is where that testing happens.
It provides the tools and processes to develop and evaluate signals, strategies, and portfolios, simulate their performance under realistic and adversarial conditions, and bridge the gap between concept and production-ready component. It is where the system’s intelligence is born and where its integrity is stress-tested.
Research Scope:
The Research platform supports: signal research, exploring new sources of predictive power, from price patterns to fundamental indicators, strategy construction , combining signals with assets and risk to form executable plans, strategy evaluation, measuring performance, robustness, and sensitivity, and portfolio construction and testing, optimizing how strategies combine, under various risk and preference assumptions.
Each of these elements evolves over time. Research allows us to compare versions, evaluate trade-offs, and discover failure modes before capital is at risk.
4.1 Backtesting
One of the tools for testing (rejecting) signals and strategies is the walk-forward backtest, the process of replaying historical data while simulating how a strategy would have behaved given only information available at the time. While Lopez de Prado [3] is right in pointing out that statistical testing is not a research tool in so far that we can test, change parameters and test again, as this leads to multiple use of data, overfitting, and mis-specification of strategies, it does, however, support:
- Signal validation/falsification: Did this feature actually predict returns?
- Strategy behavior: What did performance look like across different regimes? And is this in line with what the theory behind the signal predicts?
- Trade simulation: How would our target trades have looked? And could we have executed them?
The emphasis is on forward-only, realistic testing that mirrors the real-world flow of time. Slippage, data latency, and rebalancing constraints are modeled explicitly. The important caveat is to not use this type of testing as an optimisation tool for strategy parameters, and not to build expectations of implemented performance, but as a chance to reject the theory behind the signal/strategy.
4.2 Simulation
Backtests are powerful, if dangerous, but history is just one path. The simulation layer allows us to explore many hypothetical realities:
- Resampled historical data (e.g. block bootstrap, time-warped cross-validation)
- Synthetic market paths (e.g. regime-based volatility processes, jump models)
- Fundamental driver simulations, where supply and demand scenarios are randomly evolved and passed through pricing models
Simulations help us answer questions that history cannot: - What if 2008 had looked slightly different?
- How would this strategy behave under a commodity price shock?
- Can this signal still perform in markets we have never seen?
Simulations give us distributional insight into strategy behavior. They also allow us to perform stress testing, scenario analysis, and tail diagnostics in a structured, repeatable way.
4.3 Paper Trading
The final stage before production is paper trading: running a fully working version of the system on live market data, generating real signals and trades, but without executing them.
Paper trading answers the following questions:
- Are the signals and strategies behaving as expected in live flow?
- Are there timing mismatches or data glitches?
- Is the execution engine functioning correctly?
It’s the ultimate integration test, acting as a rehearsal for production. It also provides an early estimate of the live system’s rhythm, reactivity, and fragility.
From V1 to Beyond
Version 1 of the Research component will prioritise clarity, reproducibility, and epistemic discipline. The goal is to establish a structured environment in which signals, strategies, and portfolios can be developed, evaluated, and documented with care. Each research object will be versioned and traceable, with clearly defined boundaries between theoretical development, empirical testing, and operational deployment.
V1 will include:
- A walk-forward backtesting framework with reproducible inputs, free of lookahead bias and designed to reflect real-world constraints.
- Parameterised strategy modules that allow modular experimentation with signals, risk logic, and portfolio construction.
- Historical datasets that are versioned, audited, and explicitly mapped to strategy inputs.
- A simulation harness supporting random-seed variation, stress scenarios, and synthetic market paths.
- A live paper-trading mode connected to broker APIs, generating real-time trades without executing them — providing a full-system rehearsal.
This framework will be applied initially to two core projects:
- A long-only ETF portfolio, based on a small number of market-based signals such as trend and volatility. The focus will be on robustness, transparency, and suitability for long-term, tax-sheltered investment vehicles.
- A futures portfolio that incorporates a broader range of signals, including macroeconomic and fundamental inputs, particularly in commodity markets. This track will also support development of infrastructure for signal scaling, regime switching, and execution-aware design.
In later versions, the Research system will deepen along several dimensions:
- Simulation tools will support structural scenario generation, including policy shocks and supply-demand disruptions.
- Diagnostic modules will monitor model performance over time, detect drift, and analyse input dependencies.
- A structured model registry will support peer review, publication, and reproducible promotion of research artefacts.
- Execution-aware environments will allow researchers to incorporate liquidity, slippage, and trade constraints directly into testing.
- Portfolio-level stress tools will model aggregate system behaviour under correlated shocks, feedback loops, and systemic risk scenarios.
The underlying principle remains consistent: research is not a loose collection of ad hoc scripts but a governed, testable, and documented process. Every signal, strategy, and portfolio is the result of that process. Its rigour is what allows the Money Machine to be creative without being reckless, adaptive without being arbitrary, and confident without being blind.
5. Data
Data is not just fuel for the Money Machine, it is its world model. Through data, the system perceives, interprets, and acts. And the design of that perception begins with a deliberate act of modeling.
5.1 Data Modeling
Before any data can be processed, we must define what we are seeing. That means crafting a formal representation of all the entities the system must understand; from simple instruments and assets, to the strategies that trade them, and the portfolios that hold them. Crucially, the financial world is recursive: a portfolio may contain a strategy, which itself is defined by its allocation to assets, some of which may be synthetic constructs of strategies again.
Our data model must embrace this layered reality. It becomes the structured language through which all other components interact. Without it, the system cannot store, transform, retrieve, or reason about the world in any meaningful way.
5.2 Data Pipelines
Once the model is defined, the system must continuously ingest and process live data streams to populate it. These data pipelines ensure that new information is filtered, transformed, and integrated efficiently and accurately.
Two priorities dominate here: Latency: We must see the world fast enough to act on it. Delayed data is stale data and Quality: Data must be internally coherent, expected, and valid. Anomalies must be flagged, filtered, or repaired in real time. There are of course a whole range of additional complexities, such as consistency between live and historical data, the coverage, aggregating and fusing different data sources, changes in underlying system and data structure, etc. This is too much to even mention all of the considerations of building solid data pipelines here. Together, the pipelines serve as both the senses and the immune system of the machine.
5.3 Reference Data
The most underestimated data type in trading systems is reference data. It is everything else that makes the system's understanding of the market possible. This includes:
- The definition and metadata of financial instruments
- Contract expiries, trading hours, calendars
- Exchange mappings, tick sizes, margining details
- Symbol translations and normalizations
Without accurate reference data, the rest of the system cannot function. Institutions often dedicate entire teams to building these internal libraries. As personal system builders, we must construct our own; lightweight but precise.
5.4 Market, Portfolio, & External Data
In addition to reference data, the system must ingest:
- Market data: price and volume time series, order book snapshots, implied volatility surfaces
- Portfolio data: current holdings, realised trades, fills, cash, fx exposures, realtime risk and performance data
- Exogenous data: fundamental, macroeconomic, weather, news, or alternative data sources
Each of these feeds into different layers of the decision process, from signal construction to strategy constraints, to reporting and risk assessment.
From V1 to Beyond
In the initial version of the Money Machine, we will keep the data stack deliberately simple, but conceptually robust:
Reference data will be maintained manually in a local database, covering a curated set of instruments, exchanges, and trading calendars relevant to our first portfolios.
Market data will be ingested from free or low-cost APIs (e.g. Yahoo Finance, Quandl, FRED) on a daily schedule, and stored locally in structured formats for reproducibility.
Portfolio data will be recorded manually or exported via broker APIs, providing daily snapshots of positions, trades, and P&L.
Signal inputs will rely on publicly available macroeconomic and fundamental datasets, integrated manually into the pipeline.
All ingestion, validation, and transformation will happen via scripted batch pipelines, triggered daily or on-demand, and logged in version-controlled processes.
In later versions:
Reference data will be moved into a structured, schema-aware database, allowing dynamic validation and expansion as new instruments and exchanges are added.
Streaming ingestion will be used for high-frequency market data, with built-in anomaly detection and latency handling.
Portfolio data will be integrated live via broker APIs with automatic reconciliation and risk capture.
Data quality will be continuously assessed via statistical and structural validation layers.
A semantic query layer will be added, enabling components to access the system’s internal world model flexibly, as a shared language.
6. Reporting
While “reporting” might sound like a passive output function, exporting logs, showing dashboards, it is in fact a central part of how the Money Machine thinks about itself. It is where outputs become feedback, where monitoring turns into interpretation, and where operations are checked against purpose.
Each reporting function serves a specific decision-making need: Are we compliant? Are we successful? Are we operating as intended? Are we growing toward our broader goals?
We group these needs into six domains.
6.1 Post-Trade Analysis
Post-trade analytics begin where strategy ends; with the actual interaction between our system and the market. We analyse:
- Fills and execution quality: Did we get the volume we intended at acceptable prices?
- Trade costs and slippage: What was the realized cost of executing the strategy?
- Market behaviour during execution: Who were our counterparties? Did our activity impact the market?
- Information leakage: Did our trades reveal more than intended? Were we early or late relative to broader market activity?
These insights feed back into our execution engine, liquidity models, and even upstream into strategy and signal design.
6.2 Performance Attribution
This domain asks the most essential question: Is the Money Machine working?
Performance reporting is not just about headline returns. It is about where and why performance arises: Which portfolios, strategies, signals, or assets generated or lost value? Under which market regimes or risk conditions? Are returns consistent with backtested expectations? This feeds directly into our research layer and informs both confidence and capital allocation.
6.3 Visualisation
To understand the Money Machine holistically, we need more than data. We need interpretation. Visualisation builds both: Standard dashboards for live monitoring, diagnostics, and alerts as well as narrative tools that help evaluate whether we are achieving our mission: Are we making money the way we intend to? Is our behaviour aligned with our preferences and constraints?
6.4 Compliance
Compliance ensures that we operate within the rules, both legally and ethically. Even as a private trader, there are regulations, trading venue requirements, tax laws, and market integrity norms we must respect. We proactively monitor and document our behaviour:
- Order timing and origin
- Trade and position limits
- Use of leverage and derivatives
- Broker and exchange-specific rules
Larger funds have compliance departments; our approach is to internalise the spirit of compliance as part of robust system design.
6.5 Finance
This area connects the Money Machine back to personal financial goals. The machine operates in risk space, but it is powered and constrained by real-world money: How much capital do we have? Where is it deployed? What are the liquidity, margin, and financing needs of our strategies? Finance reporting tracks personal cashflow, available leverage, and planned future deployments. It supports budgeting, goal-setting, and ensures that the Money Machine remains a vehicle for financial well-being, not just abstract performance.
6.6 Taxes
Finally, we address taxes, not as a nuisance, but as a responsibility. We track tax-relevant trades, instrument types, capital gains, dividends, and transaction taxes like stamp duty. While we do not obsess over aggressive tax minimisation, we treat taxes as:
- A real cost to strategies
- A design constraint that may affect trading frequency and account structure
- A downstream consideration that needs reliable data and documentation
We build our reporting to be tax-aware and tax-honest.
From V1 to Beyond
Unlike some other components of the Money Machine, reporting will reach near-full scope in the first functional release. That is because robust reporting can not be an afterthought; it is a prerequisite for live trading.
In V1, we will implement:
- A complete performance reporting pipeline, including signal, strategy, and portfolio attribution
- Post-trade analytics, integrated with the execution system
- Basic visualisation dashboards for system monitoring
- Finance and capital tracking, including margin and liquidity management
- Initial compliance logging, especially around strategy constraints and broker conditions
- Tax tagging and event tracking, for easy downstream summarisation
While the depth and automation of these reports will increase over time, with better visualisations, cross-referenced analytics, and deeper statistical analysis, the categories themselves will already be present in V1.
Beyond V1, we will build: - Real-time compliance dashboards and alerts
- Narrative visualisation tools for strategic insight
- Tax scenario planning tools, especially as capital grows and business structure evolves
In short: Reporting is not a retrospective luxury; it is the instrument panel without which the Money Machine can not be steered on the macro level.
7. Infrastructure
Infrastructure is the physical and logical system that makes every other part of the Money Machine real. It's what connects signals to trades, research to results, and code to execution. Without it, everything else is just theory.
We distinguish seven core subcomponents of infrastructure, each with a specific purpose in supporting the continuous, reliable, and secure operation of the Money Machine.
7.1 Backbone
The backbone is the coordination layer: a set of protocols and interfaces for how data, configurations, and identities flow through the system. It defines conventions for how packages interact, how secrets are accessed, how runtime parameters are loaded, and how context is passed between components.
This is the connective tissue of the system: even a perfect module is useless if it cannot communicate, authenticate, or locate the data and parameters it needs. This is also where naming conventions, directory layouts, shared utilities, and policy enforcement are defined, making the system not only functional but consistent and composable.
7.2 Storage
The storage layer holds everything the system knows and remembers: raw data, transformed features, simulation results, logs, metadata, execution traces, even artifacts from past runs.
This layer is built on structured, versioned, machine-readable formats; where everything that matters is reproducible and referable. A core principle is semantic storage: not just saving bytes, but storing meaning. The choice of data formats, naming schemes, and serialization patterns reflects this commitment.
There is a clear separation between local fast-access storage (e.g., for in-memory computation and scratch data) and long-term versioned storage (e.g., datasets, models, reports). Everything in the machine is observable, logged, and auditable.
7.3 Workflow
Workflow orchestration is the choreography of processes: deciding what runs when, in what order, with what dependencies.
This includes research pipelines (e.g. walk-forward backtests, signal simulations), production runs (e.g. signal updates, portfolio construction), and maintenance jobs (e.g. data cleanup, report generation). Each is defined as a target state, what the world should look like, and the orchestration layer ensures it happens reliably and with the right prerequisites.
In practice, this may be built on make, cron, or more advanced workflow engines, but the design philosophy is clear: explicit, composable, restartable workflows, where every result is traceable to inputs and parameters.
7.4 Automation
Automation is the layer that closes the loop: once a workflow or event is triggered, what scripts, services, and processes should run? How do we monitor them, retry them, alert on failure?
The goal is not blind automation, but autonomous delegation with control. Every task should be automated where possible, but observable and overridable where needed. This includes parameter sweeps in research, backups and rollovers in storage, nightly reports in reporting, and pre-trade checks in execution.
7.5 Compute
The compute layer provides the actual capacity to do work. This includes CPU, memory, and disk resources across machines: from the local laptop to dedicated servers or cloud VMs.
Our compute design is focused on local-first, modular scale-out. Development and most research runs happen locally, with the option to push heavier workloads to remote boxes, always using the same reproducible setup. Parallelism is enabled where helpful but remains deliberate: clarity and traceability trump brute speed.
7.6 Events/Batch
The runtime system defines how the machine lives and breathes during operation. It tracks the current state of the system: what processes are running, what was last run and when, what environments are loaded, and what the runtime context is (e.g. prod vs paper, dry-run vs live).
This includes both event-driven and batch-driven operations, like triggering a new signal build after data ingestion, or running a daily portfolio rebalance at a fixed UTC time. Every action taken by the machine is logged with timestamp, identity, input hash, and outcome, forming the system’s memory and conscience.
Over time, this runtime layer can evolve into a full autonomic system, one that observes itself and adjusts its own behavior.
7.7 Health
Finally, health monitoring ensures that the machine is not just running, but running well.
This includes:
- Liveness probes (is the process up?)
- Readiness probes (is the process responsive?)
- Sanity checks (are results in expected range?)
- Alerting conditions (e.g. missing data, delayed signals, memory usage, stale prices)
- Logging and log aggregation
- Synthetic tests and watchdog timers
From V1 to Beyond
Version 1 of the infrastructure will be a deliberately minimal and comprehensible system. It will operate in batch mode, orchestrating processes through scheduled or triggered jobs that are explicitly defined, observable, and reproducible. Components such as signal building, portfolio updates, and report generation will run as well-scoped, restartable workflows, coordinated through a lightweight orchestration layer. Runtime context will be tracked through status files, logs, and CLI-based dashboards. Health checks will be implemented as simple liveness and readiness probes, supported by alerts and synthetic tests where necessary.
This first version will prioritise clarity over automation, and robustness over speed. Each subsystem, from backbone conventions and secrets handling, to logging, storage layout, and compute dispatch, will reflect core principles: composability, single responsibility, and introspectability. Every task will be deterministic and traceable, with inputs, outputs, and parameters clearly documented and versioned. Automation will be present but transparent; manual overrides will be easy and safe.
Later versions will extend this structure into a more autonomous and dynamic runtime. The orchestration layer will evolve into an event-driven framework, with components that can trigger each other based on system state, data arrival, or time-sensitive conditions. Runtime context will be continuously observable through structured logging, metrics aggregation, and visual dashboards. Health monitoring will grow into a full observability stack, supporting self-diagnostics and failure recovery.
Most importantly, the shift from batch to stream processing will transform how the system interacts with the world. Data ingestion, signal computation, execution tracking, and risk monitoring will move toward real-time responsiveness. This will be essential for market-facing modules, where delay translates into slippage, error, or opportunity loss. The infrastructure will support low-latency, long-lived agents that respond to events as they occur, not merely at scheduled intervals.
Throughout this evolution, the commitment to explicit structure and deliberate composition remains unchanged. The infrastructure is not an invisible support system; it is the active, evolving skeleton of the Money Machine, providing coordination, memory, rhythm, and control. As the system matures, so will its infrastructure, always grounded in transparency, resilience, and the ability to reason about what it is doing and why.
Summary
What you have just read is not a finished plan. It is a living map of a complex system, one that connects decision theory, market logic, technology infrastructure, and personal purpose.
Each of the seven major components described here plays a distinct role in the architecture of a functioning Money Machine. Some are conceptual (like Inputs and Research), some operational (like Trades and Infrastructure), some existential (like Reporting, where purpose and outcomes converge). Together, they form the scaffolding for a trading system that is not just technically sound, but intentional, built to express values, make decisions transparently, and evolve over time.
You do not build a machine like this all at once. You build a version. Then another. Then another. Each part matures at its own pace. Each version teaches you something new, about the markets, about your tools, and about yourself.
In future articles, we will explore the guiding philosophy and core concepts of the trading processes we are building, as well as the technology stack we build for implementing it, and the versions of the money machine this will create. Each will find its place here, within the evolving structure of the Money Machine.
Thanks for thinking with me.
References
[1] Carver, R., 2017, "Smart Portfolios", Harriman House, ISBN: 978-0-85719-531-9
[2] Carver, R., 2023, "Advanced Futures Trading Strategies", Harriman House, ISBN: 978-0-85719-968-3
[3] Lopez de Prado, M., 2018, "Advances in Financial Machine Learning", Wiley, ISBN: 978-1-119-48208-6
[4] Coinwright, P., 2025, "Robust signal construction processes.", upcoming.
[5] Coinwright, P., 2025, "On the equivalence of information and preferences in financial decision making", upcoming.